Project

Wetland Methane Flux Variability Inferred from In-Situ Eddy Covariance and Satellite Measurements

M.S. Thesis Wetland methane Google Earth Engine Remote sensing CART modeling

Abstract

Despite their small contribution to global land cover, wetlands are the largest natural source of atmospheric methane. Wetland methane emissions vary widely, and this variability introduces substantial uncertainties that limit our ability to accurately represent methane budgets. Satellite remote sensing provides scalable environmental indicators that may help explain this complexity across diverse wetland systems.

This study investigates relationships between methane flux and remotely sensed environmental drivers using eddy covariance observations from 19 AmeriFlux wetland sites. Methane flux measurements were aggregated to monthly means and paired with satellite observations from the Harmonized Landsat–Sentinel (HLS) dataset and VIIRS land surface temperature (LST) products from 2016 to 2024. Vegetation and hydrologic indices (NDVI, EVI, SAVI, NDMI, NDWI, and GVMI) were calculated in Google Earth Engine and joined with flux observations to create a dataset of 1,017 site-month observations.

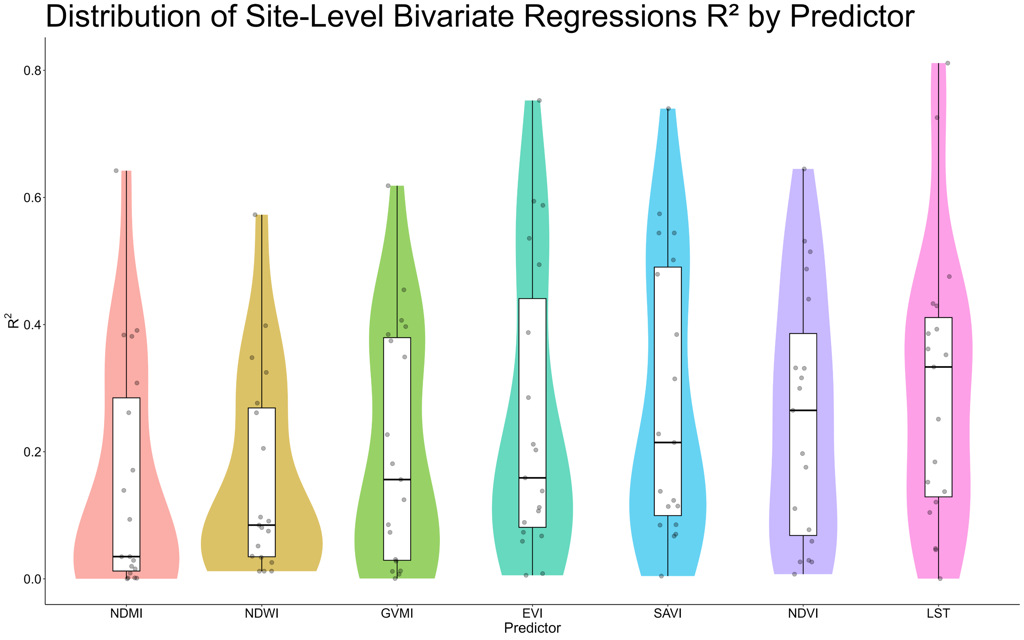
Initial linear regression analyses revealed significant relationships between methane flux and several vegetation indices, particularly EVI, which explained approximately 10–45% of monthly methane flux variability across individual sites. These results indicate that seasonal vegetation productivity captures a substantial portion of methane dynamics across wetland ecosystems. However, the strength of these relationships varied among wetland types, suggesting the presence of nonlinear environmental controls.

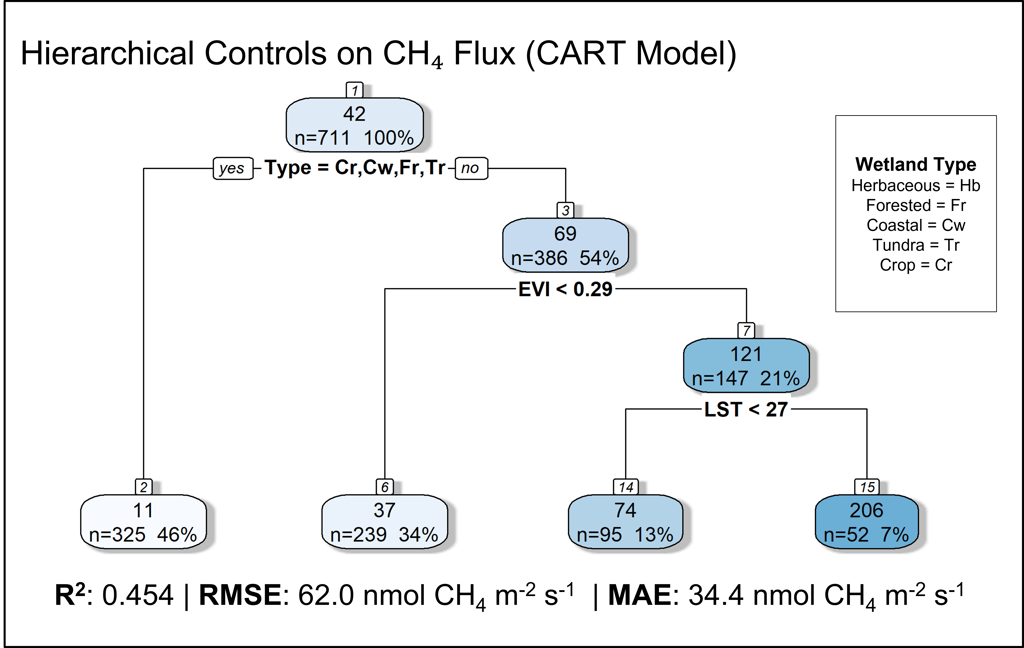
To identify nonlinear relationships and environmental thresholds, classification and regression tree (CART) models were developed to predict methane flux from remote sensing predictors and wetland type. These results indicate that wetland type was the primary partitioning in the model, whereas vegetation productivity (EVI) and LST further differentiated emission regimes. The final model explains approximately 45% of observed variability in methane flux, demonstrating that satellite-derived indicators capture meaningful ecological drivers of wetland methane dynamics. These findings highlight the potential for remote sensing to support scalable frameworks for monitoring and modeling methane emissions across heterogeneous wetland landscapes.

Project Details

Year 2026
Context M.S. Thesis
Recognition Sigma Xi First Place Graduate Poster, Outstanding Student Research Award
Presentations Presented at AGU 2025 and ASPRS 2026 Mid-South Conference, Spring Scholars Week 2026, Sigma Xi Poster Competition

Maps and Figures

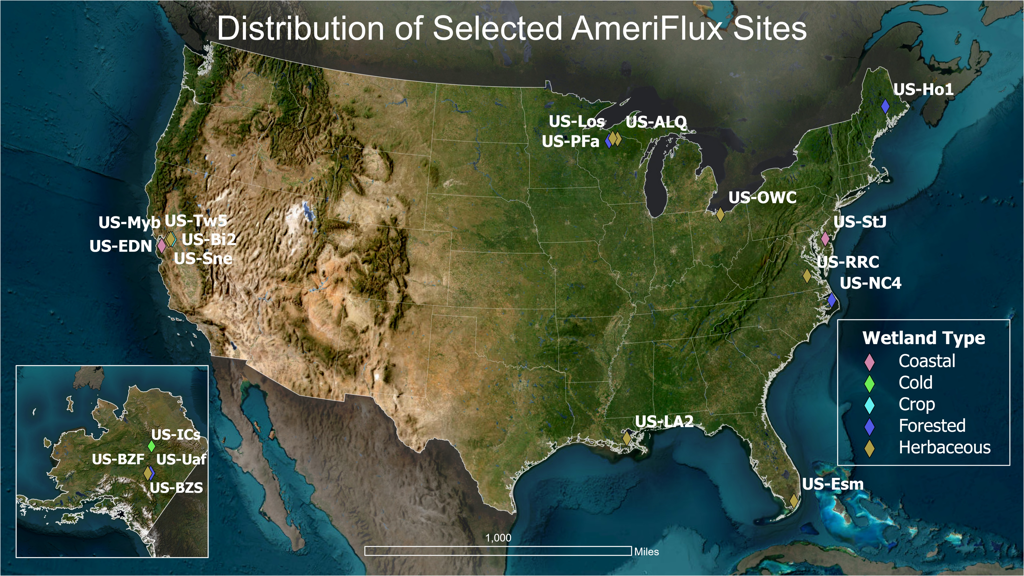
Map of AmeriFlux wetland methane flux study sites
Study site map showing the AmeriFlux wetland sites used to evaluate methane flux relationships with remotely sensed environmental predictors.
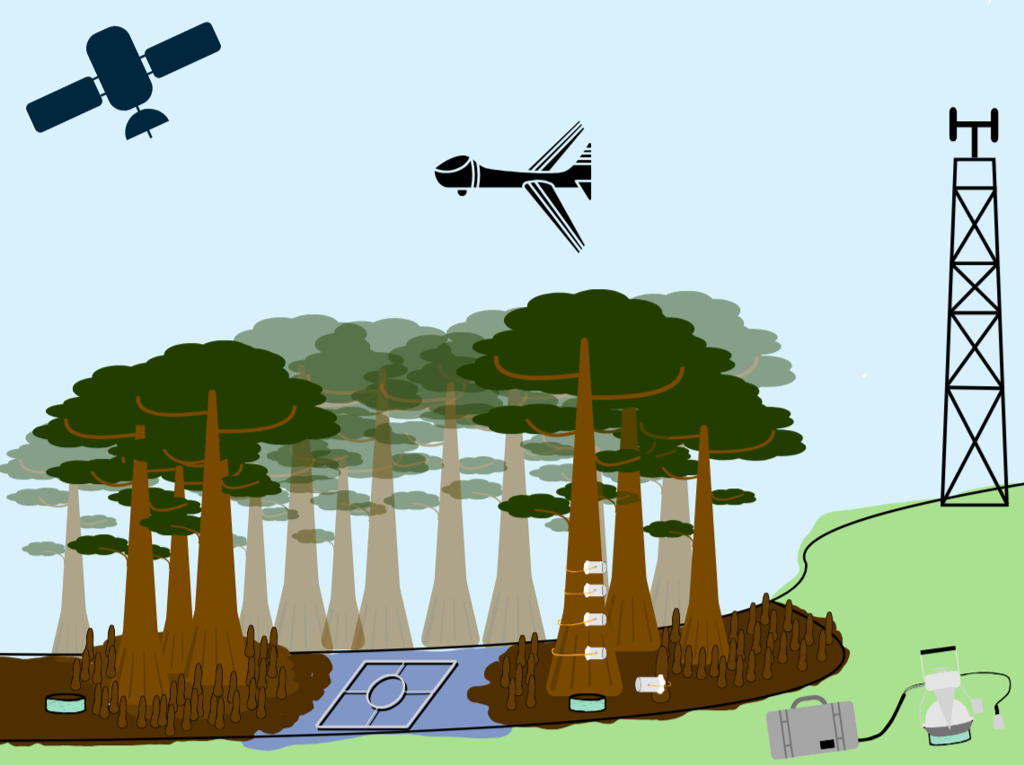
Sampling design graphic for wetland methane remote sensing workflow
Integrated sampling design at Murphy's Pond, KY. Measurements integrate satellite observations (A), UAV profiling (B), eddy-covariance tower fluxes (C), tree stem chambers (D), soil and knee chambers (E–F), and surface water chambers (G) to capture CH₄ variability across vertical and spatial scales. Together, these measurements will link fine-scale variability with ecosystem- and landscape-scale flux dynamics.
CART decision tree for wetland methane flux prediction
Pruned decision tree plot for CH₄ flux predicted as a function of remotely sensed variables. The number in the top node represents the mean predicted CH₄ flux, and n values indicate the sample size within each node. Predictor variables shown along the branches define the splitting criteria, with “yes” and “no” indicating the decision rule at each node. Subsequent nodes represent partitioned subsets of the data, with terminal nodes showing the final predicted CH₄ flux values for each group. The model identifies wetland type as the primary control on CH₄ flux, followed by vegetation condition (EVI) and land surface temperature (LST), highlighting hierarchical and threshold-based controls on flux variability.
Violin plot of bivariate R squared values by remote sensing predictor
Distribution of site-level bivariate model performance (R²) for each remote sensing predictor across all sites. Each violin represents the kernel density distribution of R² values derived from ordinary least squares regressions between monthly CH₄ flux and individual predictors at each site, where the width of the violin reflects the relative frequency of observations at a given R² value. Colored fills distinguish individual predictors, while overlaid boxplots indicate the median and interquartile range.
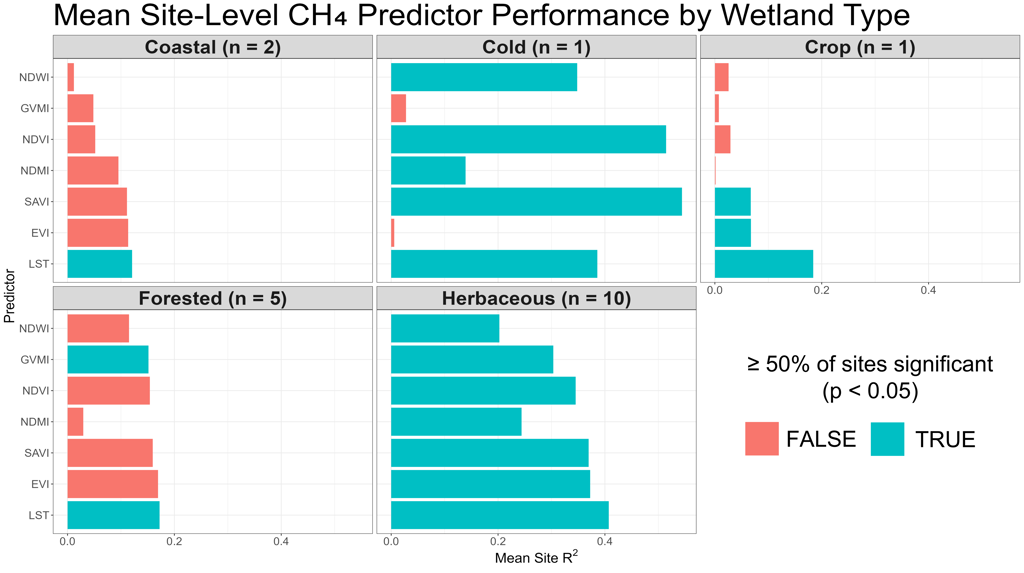
Cross-type comparison of methane flux relationships by wetland class
Mean site-level predictor performance (R2) for CH₄ flux across wetland types. Bars represent the average coefficient of determination (R²) from site-level bivariate regressions between CH₄ flux and individual remotely sensed predictors, grouped by wetland class. Predictor variables include vegetation indices (NDVI, EVI, SAVI), moisture indices (NDWI, NDMI, GVMI), and land surface temperature (LST). Colors indicate whether ≥50% of sites within each wetland type showed statistically significant relationships (p < 0.05).
Back to portfolio